people

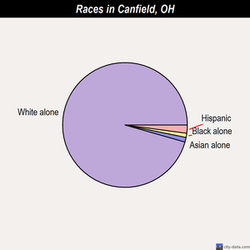
Canfield, Ohio has a urban population of 7,434 made up of 48% men and 52% women in 2012; the population has grown 0.8% since 2000. The population breaks down by race:
The population also is broken into ethnicities:
The median age of Canfield in 2012 is 45.8 compared to Ohio 39.3. The percentage of population by age is made up of:
There are 3,038 households with 78.8% being home owners. 71.5% of these households are family households and 2.3% of households include unmarried compared to Ohio 6.8%, with the average household contained 2.4 people. There are 0.1% households of Gay men couples & 0.2% households with Lesbian couples.
The median household income in 2011 for Canfield is 67,609 compared with Ohio 45,749 & the median household value for Canfield is 168, 147 compared to Ohio 129, 600.
The education in the population in 2012 can be divided by:
The percentage of households headed by women with children in the Mahoning county in 2012 was 13.2%. The percentage of woman heading households in 2010 was 15.4% and men heading households 56% (71.5% of households considered family households according to census 2010).
In 2012, 65.3% of the population is married while 18.9% have never been married, 7.8% are widowed, 0.0% separated & 8.0% are divorced.
Unemployment for Canfield is 8.6% in 2013 compared to Ohio 7.3% while it was 6.3% in 2012.
The income & poverty rate in 2012 is 7.5% which includes 100% of the African American population and 6.7% Caucasian population falling into this category compared to Ohio 15.4%.
In December 2013 there were 38 billion retired individuals benefiting 49 billion dollars from Social Security averaging 1,294 dollars a month in the United States. 74% of the those who receive benefits are retired workers and their dependents. In 2014, there will be over 59 billion individuals benefiting 863 billion dollars from Social Security.
Canfield compares to Ohio by having fewer members of the Hispanic & African American population, the median age being higher, less foreign born members, the percentage of people renting is less, and there is a higher percentage of Bachelor degrees among the Canfield population.
In 2012, there was 1 reported murder, 1 rape, 15 burglaries, 43 thefts, 2 auto thefts and 1 arson. The crime rate is 78.8 compared to U.S. average crime rate of 289.5
Mahoning county has a 10.8% of adult Diabetes comparing to Ohio 10.3% & adult obesity 28.1% comparing to Ohio 29.1%, and low-income preschool obesity rate of 13.2% comparing to Ohio 11.9% in 2012. Mahoning county lists leading causes of death per 1,000 as:
The crude death for the United States is 8 per 1,000 in 2012
The 2010 birth rate for Ohio is 7.72 per 1,000 live births
The infant mortality rate was 7.87 per 100,000 for the year 2011 in Ohio but decreased to 7.56 per 100,000 in 2012; although there was an decrease in 2012, it was still higher than the national rate which was 6.05. The Healthy People 2020 objective is to 6.0 per 1,000; this objective has been selected as a National Leading Health Indicator
The maternal mortality rate for Ohio in 2010 was 15 deaths per 100,000 births which is higher than the national average of 13 deaths per 100,000
In 2012, there was 2,419 total births in Mahoning county comparing to Ohio's 139,034. The infant mortality for Mahoning county in 2012 was 10.6 which is much higher than Ohio's rate of 7.7
Comparing Canfield to Ohio for fatal road traffic accidents from 1975-2011 per 100,000 population:
The mobility of Canfield can be organized into categories: the mean travel time to work is 24.7 minutes
The most common occupations among Canfield include:
The most common industries in 2007-2011:
The city of Canfield has voted Democrat primarily for every election from 1996-2012 specifically 63% Obama, 35% Romney and 1% other
ADVANTAGES:
The city of Canfield is a city full of shopping, eating, entertainment and business for consumers and entrepreneurs. It has a low crime rates compared to surrounding cities and higher home ownership rates. It is a great city to raise a family and live a comfortable life. There are sidewalks and lights to allow a flow of traffic and a average travel to work time that is under half an hour.
DISADVANTAGES:
The city of Canfield has a population with a majority of Caucasian men and women; there is not much diversity and 100% African American are considered under the category of poverty. The traffic is heavy making traffic build up at times. The average households in Canfield are much more expensive than Ohio's average and this may exclude a diversity of populations from being able to live there.
Sources:
- 95.3% Caucasian
- 1.8% Asian
- 1.5% Hispanic
- 0.03% Native Hawaiian/ Pacific Islander
- 0.7% 2/more races
- 0.4% African American
- 0.05% American Indian
The population also is broken into ethnicities:
- 20% German
- 14.9% Italian
- 14.2% Irish
- 11.8% English
- 5.9% Slovak
- 5.1% Welsh
The median age of Canfield in 2012 is 45.8 compared to Ohio 39.3. The percentage of population by age is made up of:
- 4.6% under 5
- 23.6% under 18
- 52.8% age 18-65
- 19% 65 & up
There are 3,038 households with 78.8% being home owners. 71.5% of these households are family households and 2.3% of households include unmarried compared to Ohio 6.8%, with the average household contained 2.4 people. There are 0.1% households of Gay men couples & 0.2% households with Lesbian couples.
The median household income in 2011 for Canfield is 67,609 compared with Ohio 45,749 & the median household value for Canfield is 168, 147 compared to Ohio 129, 600.
The education in the population in 2012 can be divided by:
- 95.9% High School Diploma
- 41.5% College degree
- 16.3% Bachelor/Graduate/Professional
The percentage of households headed by women with children in the Mahoning county in 2012 was 13.2%. The percentage of woman heading households in 2010 was 15.4% and men heading households 56% (71.5% of households considered family households according to census 2010).
In 2012, 65.3% of the population is married while 18.9% have never been married, 7.8% are widowed, 0.0% separated & 8.0% are divorced.
Unemployment for Canfield is 8.6% in 2013 compared to Ohio 7.3% while it was 6.3% in 2012.
The income & poverty rate in 2012 is 7.5% which includes 100% of the African American population and 6.7% Caucasian population falling into this category compared to Ohio 15.4%.
In December 2013 there were 38 billion retired individuals benefiting 49 billion dollars from Social Security averaging 1,294 dollars a month in the United States. 74% of the those who receive benefits are retired workers and their dependents. In 2014, there will be over 59 billion individuals benefiting 863 billion dollars from Social Security.
Canfield compares to Ohio by having fewer members of the Hispanic & African American population, the median age being higher, less foreign born members, the percentage of people renting is less, and there is a higher percentage of Bachelor degrees among the Canfield population.
In 2012, there was 1 reported murder, 1 rape, 15 burglaries, 43 thefts, 2 auto thefts and 1 arson. The crime rate is 78.8 compared to U.S. average crime rate of 289.5
Mahoning county has a 10.8% of adult Diabetes comparing to Ohio 10.3% & adult obesity 28.1% comparing to Ohio 29.1%, and low-income preschool obesity rate of 13.2% comparing to Ohio 11.9% in 2012. Mahoning county lists leading causes of death per 1,000 as:
- Heart Disease #822 rating 222.5
- Cancer #691 rating 208.2
- Chronic Lower Respiratory Disease #138 rating 38.7
- Stroke #167 rating 44
- Unintentional Injuries #113 rating 42.2
- Alzheimer's Disease #109 rating 26.5
The crude death for the United States is 8 per 1,000 in 2012
The 2010 birth rate for Ohio is 7.72 per 1,000 live births
The infant mortality rate was 7.87 per 100,000 for the year 2011 in Ohio but decreased to 7.56 per 100,000 in 2012; although there was an decrease in 2012, it was still higher than the national rate which was 6.05. The Healthy People 2020 objective is to 6.0 per 1,000; this objective has been selected as a National Leading Health Indicator
The maternal mortality rate for Ohio in 2010 was 15 deaths per 100,000 births which is higher than the national average of 13 deaths per 100,000
In 2012, there was 2,419 total births in Mahoning county comparing to Ohio's 139,034. The infant mortality for Mahoning county in 2012 was 10.6 which is much higher than Ohio's rate of 7.7
Comparing Canfield to Ohio for fatal road traffic accidents from 1975-2011 per 100,000 population:
- Canfield 9 Ohio 113 regarding fatal accident count
- Canfield 10 Ohio 167 with vehicles involved
- Canfield 9 Ohio 122 resulting in fatalities
- Canfield 3 Ohio 138 fatal accidents due to a drunk driver
- Canfield 1 Ohio 12 involving pedestrians in fatal accidents
- Canfield 17 Ohio 272 persons involved in fatal accidents
The mobility of Canfield can be organized into categories: the mean travel time to work is 24.7 minutes
- 94,457 drove alone in a car
- 9,219 carpooled
- 874 used the bus
- 1,660 walked
- 2,176 worked from home
- 46 people used a bicycle
- 58 traveled by taxi
- 60 rode a motorcycle
The most common occupations among Canfield include:
- 9% other management occupations except farmers and farm managers
- 6% other sales and related workers including supervisors
- 6% sales representatives, services, wholesale and manufacturing
- 6% top executives
- 4% engineers
- 4% lawyers
- 3% metal workers and plastic workers
The most common industries in 2007-2011:
- 19% manufacturing
- 13% retail trade
- 9% wholesale trade
- 9% educational services
- 9% health care and social assistance
- 8% transportation and warehousing
- 7% construction
The city of Canfield has voted Democrat primarily for every election from 1996-2012 specifically 63% Obama, 35% Romney and 1% other
ADVANTAGES:
The city of Canfield is a city full of shopping, eating, entertainment and business for consumers and entrepreneurs. It has a low crime rates compared to surrounding cities and higher home ownership rates. It is a great city to raise a family and live a comfortable life. There are sidewalks and lights to allow a flow of traffic and a average travel to work time that is under half an hour.
DISADVANTAGES:
The city of Canfield has a population with a majority of Caucasian men and women; there is not much diversity and 100% African American are considered under the category of poverty. The traffic is heavy making traffic build up at times. The average households in Canfield are much more expensive than Ohio's average and this may exclude a diversity of populations from being able to live there.
Sources:
- CFHS & RHWP Health Status Profile: Mahoning County, Ohio. (n.d.). www.odh.ohio.gov. Retrieved June 11, 2014, from http://www.odh.ohio.gov/~/media/ODH/ASSETS/Files/cfhs/child%20and%20family%20health%20services/cfhs%20community%20health%20assessment/mahoningcounty.pdf
- Canfield, Ohio. (n.d.). City-Data . Retrieved June 11, 2014, from http://www.city-data.com/city/Canfield-Ohio.html
- Death rate, crude (per 1,000 people). (n.d.). Data. Retrieved June 9, 2014, from http://data.worldbank.org/indicator/SP.DYN.CDRT.IN
- Mahoning County District Board of Health. (n.d.). 2013 Annual Report . Retrieved June 11, 2014, from http://www.mahoninghealth.org/wp-content/uploads/file/Documents/Documents/AnnualReports/BOH%20Annual%20Report%202013%20FINAL%20-%20DIGITAL.pdf
- Mahoning County, Ohio (OH). (n.d.). City-Data . Retrieved June 11, 2014, from http://www.city-data.com/county/Mahoning_County-OH.html
- Neonatal, postneonatal, and infant mortality, Ohio and counties, 2007-2011 . (n.d.). www.odh.ohio.gov. Retrieved June 11, 2014, from http://www.odh.ohio.gov/~/media/ODH/ASSETS/Files/cfhs/Infant%20Mortality/IM%20by%20state%20%20county%2020072011b.ashx
- Ohio Department of Health. (n.d.). Infant Mortality . Retrieved June 11, 2014, from http://www.odh.ohio.gov/~/media/ODH/ASSETS/Files/data%20statistics/maternal%20and%20child%20health/wh_infantmortalityrate.ashx
- Ohio Maternal Mortality Rate Up 138 Percent. (n.d.). WOSU News Ohio Maternal Mortality Rate Up 138 Percent Comments. Retrieved June 11, 2014, from http://wosu.org/2012/news/2010/04/19/ohio-maternal-mortality-rate-up-138-percent/
- United States Census Bureau. (n.d.). Canfield (city) QuickFacts from the US Census Bureau. Retrieved June 11, 2014, from http://quickfacts.census.gov/qfd/states/39/3911360.html
